Obtaining a list of all users from a tenant based on filter conditions like “country” or “department” is a common task for a Microsoft 365 administrator. While the Microsoft 365 Admin Center or Entra portal can provide a list of all users, they currently lack the feature to apply filters based on specific requirements.
For example, if you need a list of all users belonging to the HR department, the current process requires exporting all users to an Excel sheet and applying a filter on the “Department” column. This can become quite laborious, especially when dealing with a large number of users.
This article will guide you on how to retrieve users based on specific filter conditions using PowerShell and CoreView.
1. Using PowerShell
To retrieve Microsoft Entra ID users based on specific filter conditions, you can use the Microsoft Graph PowerShell module. First, ensure that the Microsoft.Graph module is installed and active:
Install-Module Microsoft.Graph
Import-Module Microsoft.Graph
Connect-MgGraph
Once connected to Microsoft Graph, you can use various cmdlets to find and manage Entra ID users:
Examples:
Get-MgUser
# Displays a full list of user accounts
Get-MgUser -Filter "startsWith(jobTitle, 'Sales')"
# Retrieves all the users whose job title starts with 'Sales', such as Sales Manager and Sales Assistant.Get-MgUser -Filter "department eq 'HR'"
# Retrieves all the users whose department is HRGet-AzureADUser -Filter "Country eq 'India'"
# This command gets all the users whose country equals to IndiaAlthough this is helpful in most scenarios it has certain restrictions when applying the filter conditions on certain properties. For example we cannot use same script to get all the users of a particular domain or users of particular licensed assigned.
2. Using CoreView
With CoreView, you can filter your user list using many different parameters. Let's see the steps to achieve this.
- Log in to the CoreView portal
- Select “Reports > Users > Active users”. This will display all the users available in the tenant.

- Next, open the “Columns” dropdown and pick all the columns you want to get information from. You'll use this information later when you set up the filter condition.
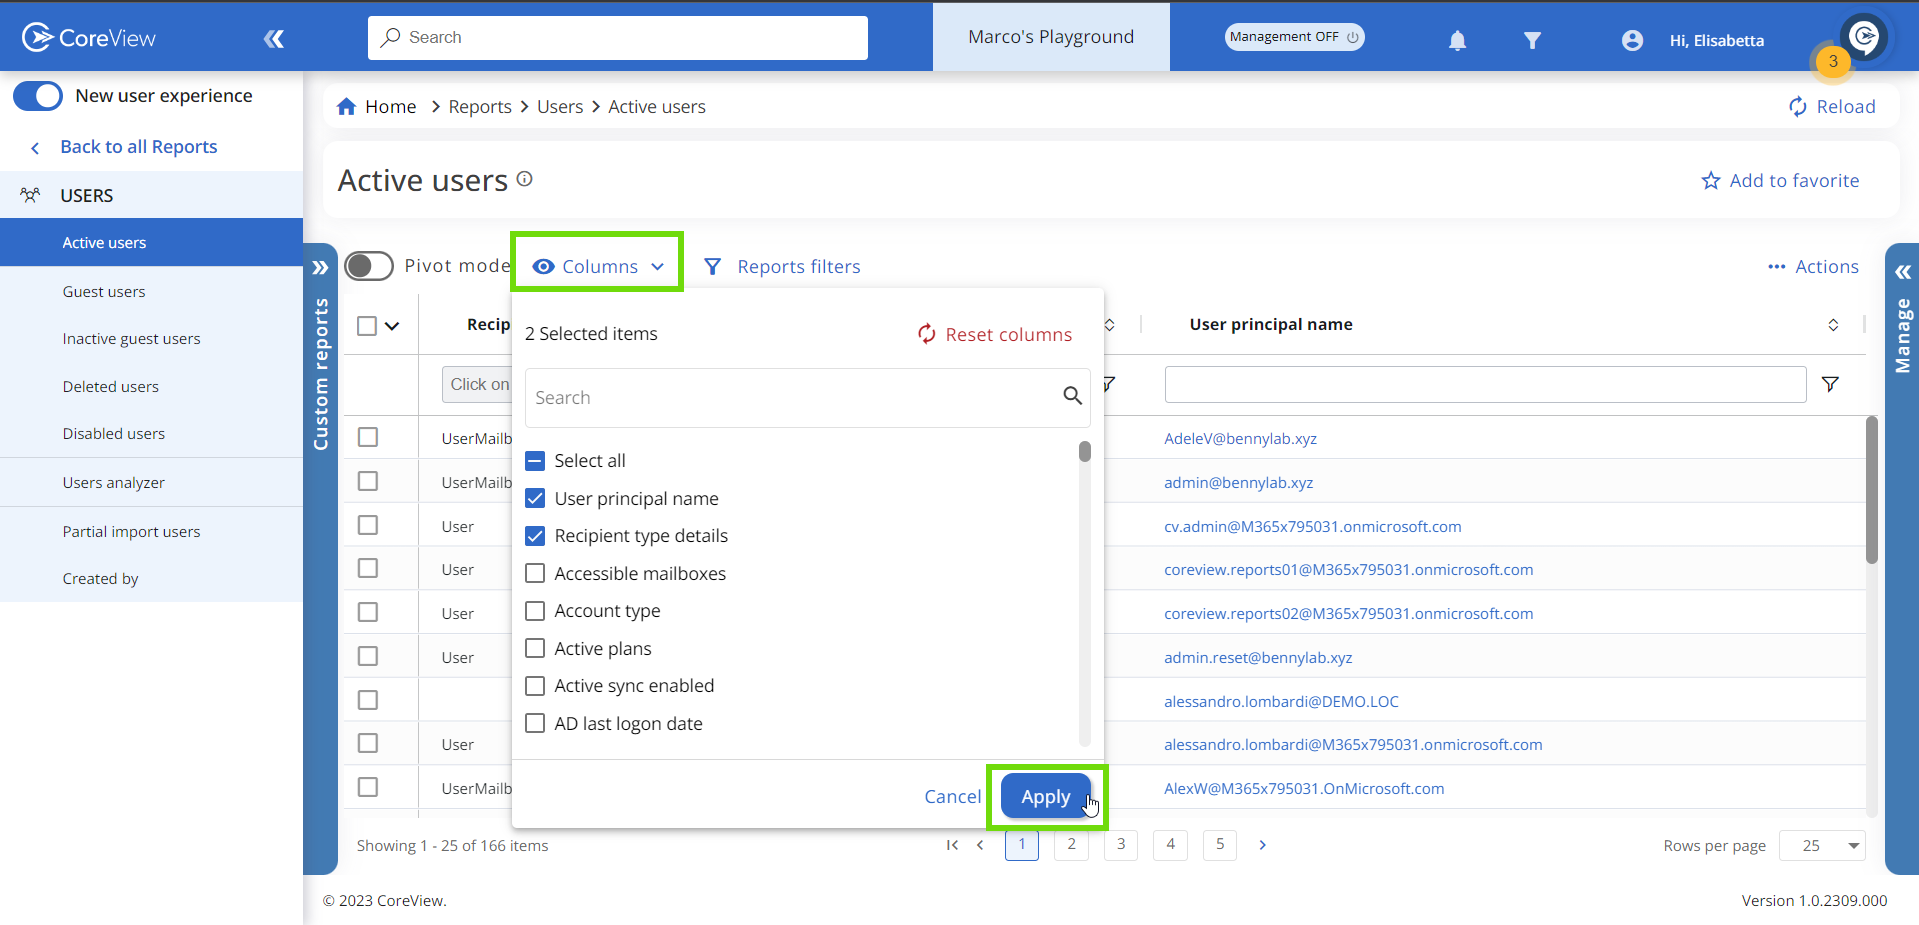
- Click “Apply”. This action will load the user report, showing all the columns you selected.
- Now, you can set up a filter based on what you need. For example, if you want to see all the users from a specific domain, just use “Contains [domain name]”. You can also use “Domain equals [domain name]”. This will show all the users from that domain.
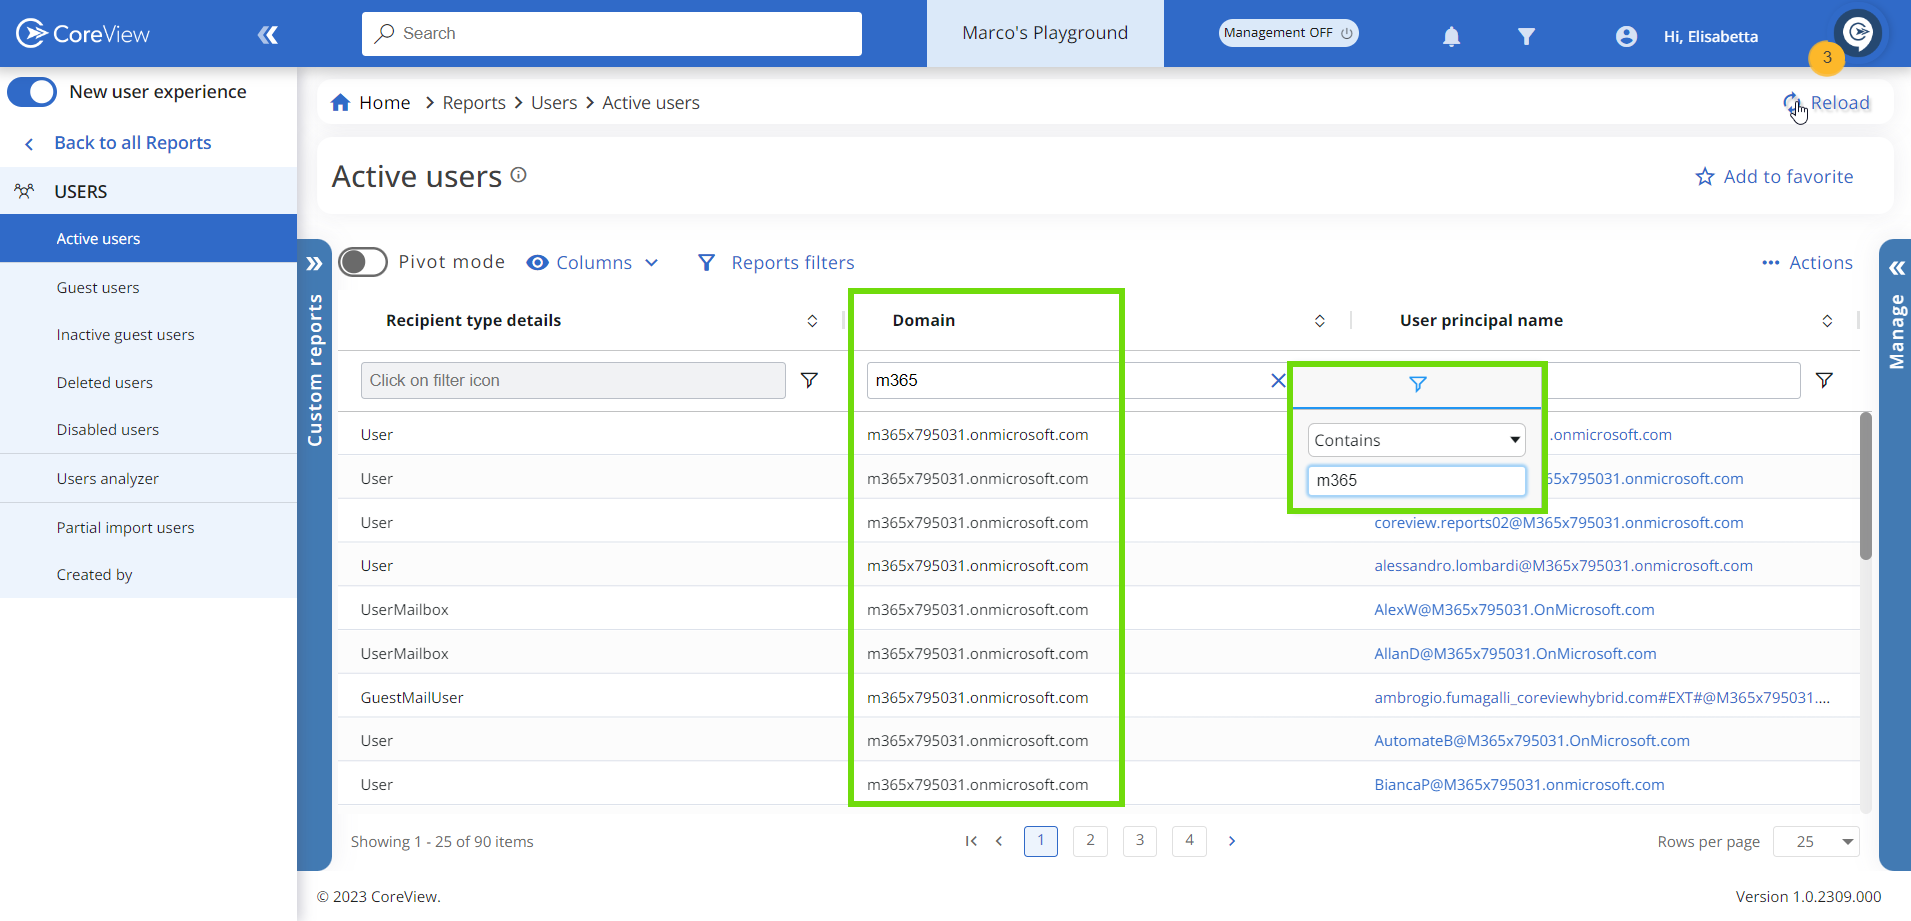
In the same way, you can filter any column based on what you need. After filtering, you can export the results to an Excel file or take action on them directly from the report.
Pivot charts
If you prefer to view your filtered data in an aggregator format instead of a table, just enable the “Pivot mode” toggle located in the top left corner. For further information, please visit this article: Pivot mode in reports.