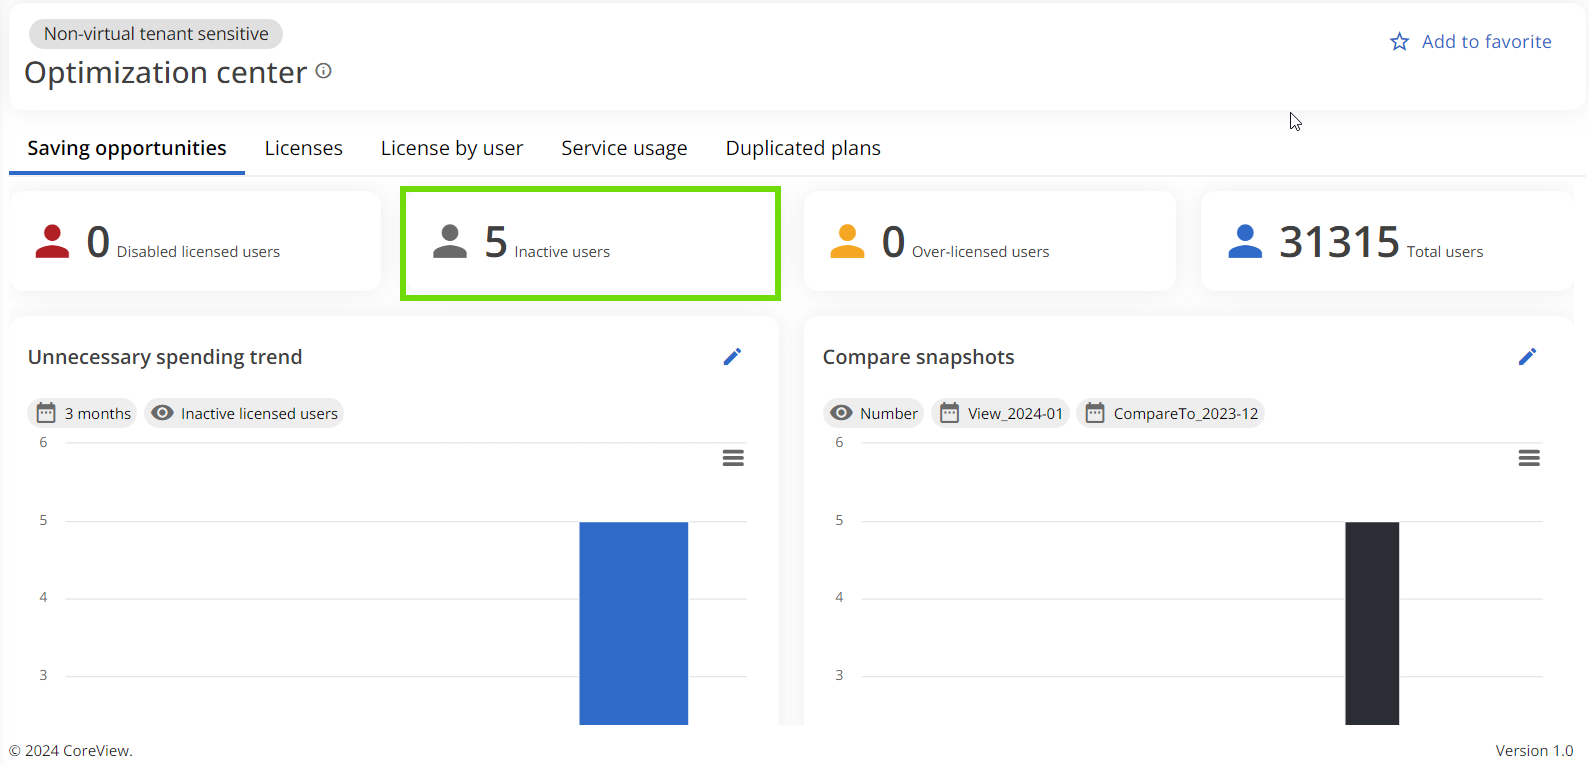
Le Centre d’optimisation est conçu pour identifier les opportunités d’économies sur les licences. À partir de ce rapport, vous pouvez consulter les licences inutilisées, en doublon ou sur-allouées, ainsi que les utilisateurs qui ne tirent pas parti des fonctionnalités offertes par leurs licences. L’objectif final est d’optimiser les licences assignées aux utilisateurs et de libérer les licences les plus coûteuses pour ceux qui en ont besoin.
Si les Pools de licences sont configurés, un tableau présentant la répartition par pools de licences sera visible sur cette page. Sinon, cliquer sur un widget vous redirigera vers le rapport correspondant où vous pouvez consulter les données par utilisateur.

Opportunités d’économies
Le rapport « Opportunités d’économies » est basé sur trois moteurs d’économies différents : utilisateurs licenciés désactivés, utilisateurs licenciés inactifs et utilisateurs sur-licenciés. Ce rapport se concentre sur les « licences principales », c’est-à-dire celles de Microsoft 365 et Office 365 qui fournissent aux utilisateurs les applications essentielles. La liste des licences considérées comme « principales » comprend celles faisant partie de :
- Enterprise Mobility + Security (EMS)
- Microsoft 365 Enterprise
- Microsoft 365 Frontline
- Office 365 Enterprise
- Microsoft 365 GOV
- Office 365 GOV
- Microsoft 365 Educational
- Office 365 Educational
- Microsoft 365 Business
- Microsoft 365 Apps
La définition des moteurs d’économies est la suivante :
- Utilisateurs licenciés désactivés : utilisateurs ayant une licence principale et des identifiants bloqués
- Utilisateurs licenciés inactifs : utilisateurs activés avec TOUTES les licences principales inactives depuis au moins 90 jours. Cela s’appuie sur le champ « IsActive90 ».
- Utilisateurs sur-licenciés : utilisateurs actifs ayant plus d’une licence principale, dont au moins une est active.
Calcul du champ IsActive90
Les champs « IsActive90 » et « IsActive30 » sont calculés par CoreView en se basant sur plusieurs attributs différents. Voici les attributs qui contribuent à « IsActive90 ».
| Application | Règle |
|---|---|
| Exchange | Plan Exchange non vide ET Dernière action utilisateur Exchange dans les 90 derniers jours ET RecipientType = UserMailBox. Si "Skip Active MailUser" est faux, alors on prend aussi en compte RecipientType=MaillUser |
| OneDrive | Plan OneDrive non vide ET Dernière action OneDrive dans les 90 derniers jours |
| SharePoint | Plan SharePoint non vide ET Dernière action SharePoint dans les 90 derniers jours |
| Viva Engage | Plan Viva Engage non vide ET Dernière activité Viva Engage dans les 90 derniers jours |
| Teams | Plan Teams non vide ET Dernière activité Teams dans les 90 derniers jours |
| PowerBI | Plan PowerBiPro non vide ET Dernière action Power BI dans les 90 derniers jours |
| Installations Office 365 | Plan Office365Pro non vide ET Dernière activité M365 Client App dans les 90 derniers jours |
| CRM | Dernière activité CRM dans les 90 derniers jours ET SKU faisant partie de la liste suivante : [“Dynamics CRM","Dynamics 365","DYN365","CRM","D365","Dynamics_365"] |
Licences
Il fournit des informations sur quels utilisateurs utilisent les produits/services associés à des licences spécifiques. Ce rapport vous permet de réaffecter ou de désactiver des licences selon les besoins et d’engager la conversation avec des utilisateurs ne profitant pas pleinement de leurs licences.
Nombre de licences principales
Cette propriété recense les principales licences Microsoft 365 et Office 365 qui fournissent les applications essentielles aux utilisateurs. Elle exclut les ajouts et services achetés séparément, tels que Teams et Exchange Online.
Filtres avancés
La fonctionnalité Filtres avancés vous permet d’affiner vos recherches en fonction de combinaisons de licences et d’utilisation des applications. Ces filtres servent principalement à :
- Agir comme critères de filtrage
- Fournir un total dynamique des enregistrements correspondants
Par exemple, dans un tenant de 1 000 utilisateurs dont 50 disposent de licences E5, filtrer sur les utilisateurs E5 recalculera les services/applications utilisés par ces 50 utilisateurs.
Niveaux de filtres
Le filtre fonctionne sur trois niveaux :
- SKU
- Utilisation des services
- Carte d’utilisation
Utiliser les filtres en combinaison
Voici comment utiliser ces filtres en combinaison :
- Sélectionner des SKU : choisissez un ou plusieurs SKU principaux (ex. : licence Microsoft E5).
-
Utilisation des services :
- Dans la section « Utilisation des services », sélectionnez un service (par exemple, SharePoint) et marquez-le comme « Inactif ». Ce filtre retournera les utilisateurs ayant une licence E5 qui n'ont pas utilisé SharePoint au cours des 90 derniers jours. Ces utilisateurs peuvent potentiellement migrer vers un plan E3 pour optimiser l'utilisation des licences.
- Sélectionner un service comme « Actif » retournera les utilisateurs utilisant activement ce service sous les plans de licence sélectionnés.
- Marquer un service comme « Ignorer » ne prendra en compte aucune activité ou inactivité sur ce service.
-
Carte d’utilisation :
- Le filtre « Carte d’utilisation » se mettra à jour automatiquement pour afficher des icônes de services actifs à côté du nombre d’utilisateurs les utilisant. Ceci offre un aperçu des informations disponibles dans le rapport sous la propriété « Plans actifs » pour chaque utilisateur.
- Sélectionner une option dans la carte d’utilisation filtrera encore davantage les résultats, n’affichant que les utilisateurs correspondants.
Points importants
- Valeurs ambiguës : En cas de filtre mal utilisé, il peut y avoir des valeurs ambiguës. Par exemple, si aucun SKU n'est sélectionné pour un utilisateur mais qu’un service est marqué comme actif ou inactif, le même utilisateur pourrait apparaître dans la recherche car il peut utiliser activement un service sur un SKU mais pas sur un autre.
- Licences additionnelles : Si aucune licence principale n'est choisie mais qu’un ajout l’est, comme Teams Exploratory, puis que l’utilisation de Teams est marquée comme inactive, cela peut aboutir à zéro résultat. Dans ce cas, le filtre SKU sera supprimé automatiquement et le filtre recherchera les utilisateurs inactifs sur Teams, quelle que soit la licence attribuée.
- Filtres de colonnes : Le décompte des Filtres avancés prend en compte tous les filtres de colonnes qui ont déjà été appliqués.
Visibilité des données d’utilisation de Visio et Project
Les dernières informations d’utilisation pour Visio et Project ne seront pas visibles si l’option « Afficher en clair les noms d’utilisateur, de groupe et de site dans tous les rapports » est activée dans la section Rapports du Centre d’administration Microsoft. Ce paramètre empêche l’association des données d’utilisation de Visio et Project avec les utilisateurs concernés. Pour en savoir plus, veuillez consulter la documentation Microsoft.
Licence par utilisateur
Le rapport « Licence par utilisateur » aplatit les informations des licences par utilisateur pour faciliter l’identification des utilisateurs possédant des combinaisons de licences. Il donne une vue d'ensemble de la répartition et de l’utilisation des licences Office 365 parmi vos utilisateurs. Il fournit le nom complet de chaque utilisateur, le nom de connexion, le type d’abonnement, ainsi que les licences pour les applications web Office telles que la licence Exchange, la licence Skype, la licence SharePoint et la licence Office Professional Plus.
Utilisation des services
L’onglet « Utilisation des services » vous aide à comprendre rapidement et facilement quelles licences sont utilisées dans votre organisation, ainsi que leur coût associé. Vous pouvez suivre et analyser les indicateurs d’utilisation par service, par domaine ou selon d’autres critères pour avoir une vision complète du coût et de l’utilisation des licences au sein de votre organisation. Depuis le panneau « Filtres avancés » vous pouvez exclure les nouveaux utilisateurs créés et masquer les colonnes de coûts pour plus de clarté.
Plans en doublon
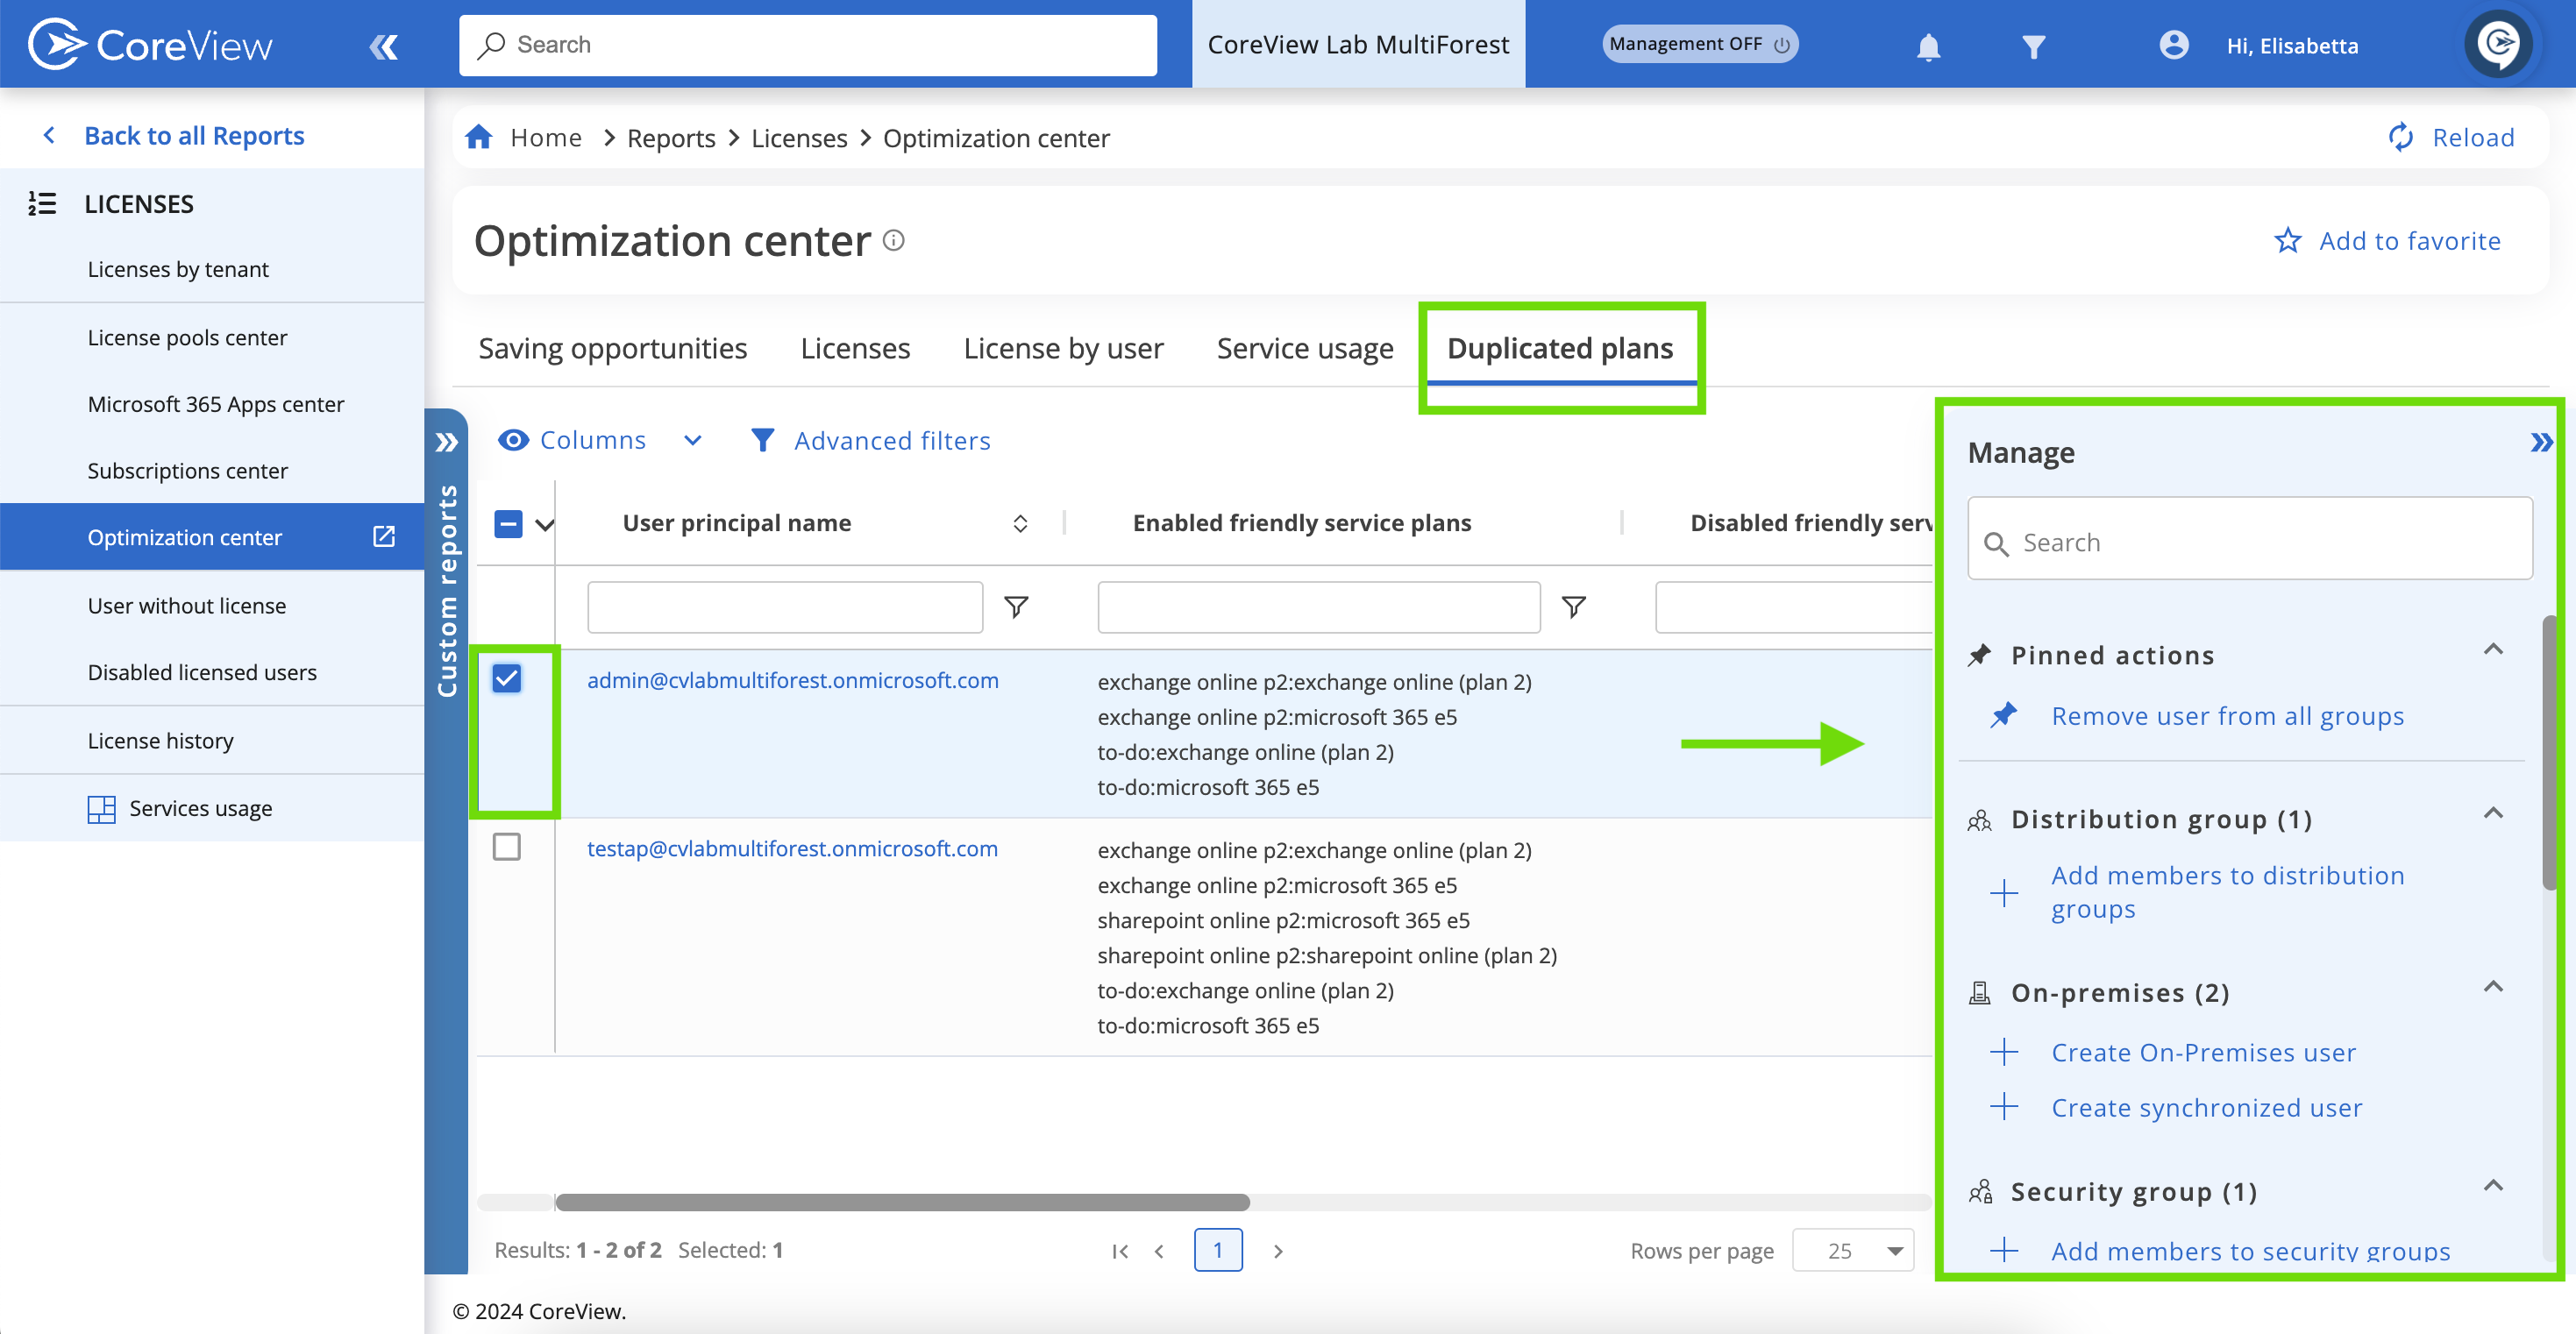
L’onglet « Plans en doublon » est conçu pour vous aider à identifier facilement les utilisateurs ayant reçu des licences comportant des plans de service qui se chevauchent. Cette fonctionnalité est particulièrement utile pour repérer les licences qui pourraient être réaffectées, offrant une vue plus détaillée que les onglets « Opportunités d’économies » ou « Licences ».
Pour modifier des licences et des propriétés directement à partir de cet onglet, cliquez simplement sur un utilisateur. Un panneau de gestion apparaîtra, affichant toutes les actions de gestion possibles. Ce processus simplifié facilite la gestion et l’optimisation de vos licences.
Les actions de gestion ne sont pas incluses dans la solution Essentials.

